

Growing degree days are used to estimate the growth of plants and development of insects during a growing season. The basic concept is that certain occurrences will take place if the temperature exceeds the temperature base (TBASE) for a particular period of time.
The basic theory is not complex, but there are some further scientific modifications, so we will stick with the basic framework for now.
GDD is calculated by finding the mean temperature (TMEAN), which is determined by taking the high temperature and the low temperature for the day, adding them together, and dividing by 2. Simple right? So that is where we start.
For instance, if the high was 77 F and the low 51 F, then the math would look like this: (77+51)/2 or 128/2 giving us a mean temperature or TMEAN of 64. This mean temperature is compared to the base temperature and will give us the GDD calculation.
For example, corn follows closely to the accumulation of average daily temperatures. The minimum daily temperature for corn development is 50 F so that becomes our TBASE. Using our calculations from the previous paragraph in this scenario, the TMEAN was 64, subtract TBASE from that (50) and you will have 14 degree days. Nobody likes a math class so there are numerous websites that will do the arithmetic for you and already have the weather data! Kevin recommends the one from Ohio State University which only asks for your zip code, and it will spit out a number. So at the end of May, the number was 505 which is right after Catawba Rhododendron full bloom (503) and just a little bit before White Fringetree full bloom (517). Looking a little bit further, it will show that Bronze Birch Borer adults are due to emerge at 547 GDD.
So why is this important? Because some of these visible phenological development indicators are closely tied to insect and weed development stages. We can use some of these sightings as a call to action for managing certain seasonal problems.
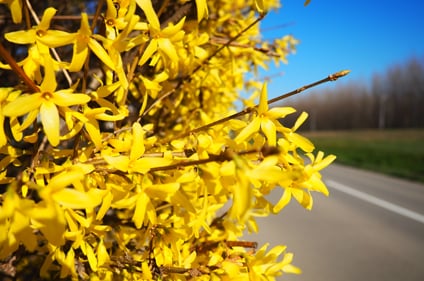
For instance, many areas of the country will use the Forsythia as an indicator of crabgrass pre-emergent timing. In fact, full Forsythia bloom occurs at or around 116 degree days and smooth crabgrass (the first to show up in the Ohio area) will emerge around 155 degree days. Now it is making some sense - phenological markers can indicate timing of applications. Again, these are not 100% correct in all situations, but they can act as a rough estimate.
Experts calculate growing degree days to predict multiple different pest stages which tends to be fairly accurate. This is where we lean on them for control measures to prevent particularly harmful pests like Annual Bluegrass Weevil which can be extremely destructive left unaddressed and much easier to manage in younger stages of life.
Here is the link again to the Ohio State University Phenology Calendar, and we'll add a couple of others as well. If you type in the zip code for downtown Cleveland (44114) you will see the GDD then click on the full calendar to see the events as they relate to GDD. As always, send us your feedback and let us know which tools you know about and use!
Contact the Ewing Technical Services Team with any questions.

